Archive for August, 2009

Book Review: “Rich & Thin” shows you how to turn calories into cash

Saturday, August 29th, 2009

Dr. Kris has been taking a mini-vacation this week and as one of my divertissements, I’ve been going to the beach to catch up on some reading. As a Seeking Alpha contributor, I’m entitled to free books provided I review them. There’s a few from McGraw-Hill collecting dust on my bookshelf, so I thought that now would be a perfect time to kick back, soak up some late summer sun, and dig into my backlog of financial literature.

I decided to start with the one that seemed the most fun and the least mentally taxing: Rich & Thin: Slim down, shrink debt, & turn calories into cash.

This book, written by mother/daughter team Deborah McNaughton and Melinda Weinstein, is rich in premise but lean in content. No author could wish for a higher concept than something as sexy as turning calories into cash. I’m betting this book got the green light based solely on the pitch; based on its content I would title it Personal Finance Lite.

The premise: The Money Calorie Counter
The book’s major selling point (printed right on the cover) is the Money Calorie Counter, or MCC, which provides the vehicle for the premise. The MCC is an 11 page table of fast-food items broken down by cost and calories. The authors say that by eschewing your fast food habit not only can you shrink your waistline by forgoing the empty calories, but expand your net worth by taking the money you would have spent and putting it into an interest-bearing account.

The idea is hardly new but seeing the results in tabular form is original. For example, if you’re in the habit of buying a quarter pounder with cheese, large fries, and a medium chocolate shake as a snack every working day of the week, the Money Calorie Counter says that you’ll pack on an extra 142 pounds at a cost of $1918 annually. If, instead, you take that money and put it in a monthly compounding mutual fund that gets a 10% annual return, by the end of 20 years you’ll have saved $121,259 (and presumably you’ll be in much better physical health, too).

Sounds like a plan, but what the authors forget is that for many folks, the hamburger, fries, and shake isn’t a mid-afternoon snack, it’s a meal. People need to eat, for crying out loud! Now you can cut calories by opting for healthier choices such as salads, but you’ll be subtracting from your piggybank instead of adding to it as these items cost more (according to the MCC), a fact the authors neglect to mention.

The real value of the Money Calorie Counter is that it does drive home the magic of compound interest. Most of us already know this but honestly, do we do anything about it?

The rest of the story: Rehashing the basics
To fill out the rest of the 190 pages, the authors cover the basics of dealing with credit card debt, budgeting, setting up retirement accounts, sprucing up your credit report, and using real-estate for wealth-building. (This book was published in 2007 so some of this advice is already dated, especially the last one where the authors assume that real-estate will always be an appreciating asset.)

They also devote a chapter to hackneyed money-saving tips (clip coupons, shop around for car insurance, don’t drink lattes, etc.). One particularly hilarious piece of advice is to cancel your gym membership and don’t buy expensive exercise equipment. Instead, substitute a cinderblock or stool for your step workout and use canned vegetables for hand weights. (Just close your drapes when you do it!)

Don’t get me wrong, Rich & Thin contains plenty of useful information. Geared more towards the financial novice, the information is well-presented and easily digestible. “True story” sidebars add a humanizing element. However, there’s very little information here that can’t be found on financial websites (MSN Money, Yahoo! Finance) or by watching Suze Orman.

If you’re considering stuffing this book into your beach bag, I’d suggest tossing in other reading material because in terms of literary weight, Rich & Thin is about as filling as a Chicken McNugget.
The 1000% Club

Monday, August 24th, 2009

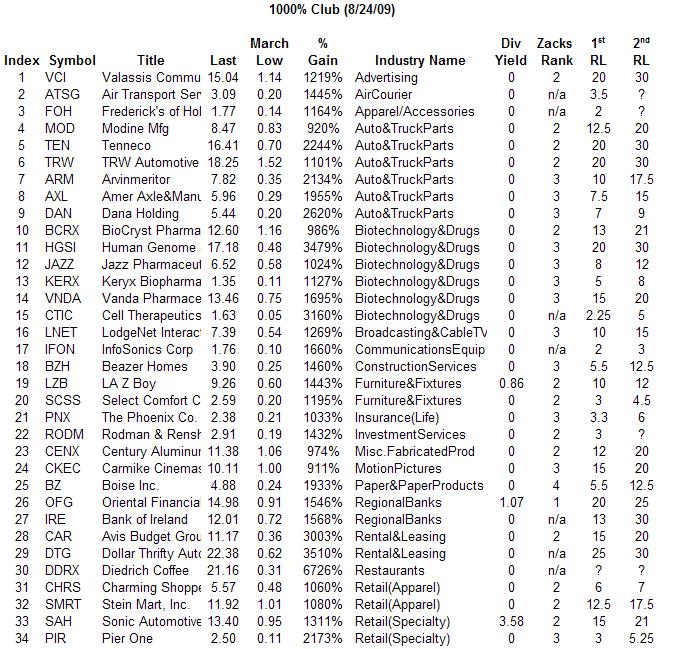
Last week, CNBC featured some members of the thousand percent club, or those stocks that have gained over ten times their value since the March low. I know from surfing thousands of charts per week that many stocks have indeed posted incredible gains, but I was interested in finding out approximately how many companies could claim membership in this exclusive 1000% club.

To that end, I discovered 34 thousand percenters that are trading over a buck and listed on major exchanges. In fact, with the exception of Fredrick’s of Hollywood (FOH) that is listed on the AMEX, the rest all reside on the Nasdaq or the NYSE.

The chart below lists them all sorted according to industry grouping.

1000-percent-club-8-21-09

Note:  RL denotes Resistance Level.

Observations
The biggest gainer is Dietrich Coffee (DDRX) at over 6700%. Management deserves a gold medal for dumping many of its retail outlets and focusing on its wholesale business which has been going gangbusters.

Avis (CAR) must really be trying harder because it and Dollar (DTG) are the 1000% club runners-up.  (Hertz (HTZ) is “only” up 500%). The economic factors that caused these companies’ stock prices to collapse have shifted into reverse which, according to a recent MSN Money article, is the reason for their recent gains.

Riding the coattails of the auto industry are the parts suppliers. Because of their strong balance sheets and ability to diversify operations during the recession, several of them were recently upgraded, including Arvinmeritor (ARM) and TRW (TRW).

Representing the largest industry group in the 1000% club are niche biotechs that have had successful clinical trials on key drugs. It’s no surprise that Biocryst (BCRX), a manufacturer of swine flu therapies, made the list.

Is there still some game left in these gals?
These stocks have come so far so fast that one might expect them to run out of steam. But considering where these stocks were trading pre-market swoon, there’s still a lot of room for growth. As an extreme example, consider Cell Therapeutics (CTIC) which once traded over $3000 (in 2000) and is now trading for less than $2!

Should the market reverse course, these stocks could very well be the ones to suffer first considering their recent run-up. But if the market continues behaving bullishly, many could still offer significant gains.  You’ll have to do your own due diligence on this one and as an aid, I’ve included the next resistance levels based on weekly and monthly charts to help you with price targeting. (These are general guidelines only!) I’ve also included their Zacks ranking (with the 1 and 2 ratings reserved for the healthiest companies)  for further reference. Only Oriental Financial (OFG) earned the Zacks highest position. It recently posted its eighth consecutive earnings surprise and despite its latest run-up, it’s trading at only four times forward earnings.  Zacks recently added it to their value portfolio

On a personal note, I’m glad to see Fredrick’s of Hollywood (FOH) busting out. (Oh, you knew that was coming!) The company recently hired a former Walmart executive as veep of product development. I sincerely hope she can breathe new life into their product line as the company’s aging business model could use a good kick in the pants.

Making sense of economic data

Friday, August 21st, 2009

Are you confused about economic data reports? Have no idea what they mean? Then Dr. Kris is here to rescue you.

In my inbox today I received a link to a slideshow that describes in simple language ten of the most widely watched economic indicators:

Jobless claims
Consumer Price Index (CPI)
Non-farm payroll
Producer Price Index (PPI)
Beige Book
Consumer Confidence Index (CCI)
Durable Goods Orders
Gross Domestic Product (GDP)
Retail Sales Index
Housing Starts

How to meld these data with your stock portfolio (if you’re a long-term investor) is another question, but one you should be asking either of yourself or your money manager.

Maybe not now, but sometime in the future you might want to acquaint yourself with the inflationary indicators like the CPI. The Federal Reserve has this info on its website along with other FAQ’s.

You might find the site very interesting, especially the Consumer Credit page.

As an aside, most people don’t know that the Federal Reserve Board (of which the past and present Fed chairmen have held the weight of the world in the palm of their hands) is not a government institution nor has it ever been. It is a privately held company that, in the words of Louis McFadden, the Chairman of the House Banking and Currency Committee in the 1930s said:

“Some people think that the Federal Reserve Banks are United States Government institutions. They are private monopolies which prey upon the people of these United States for the benefit of themselves and their foreign customers; foreign and domestic speculators and swindlers; and rich and predatory money lenders.”

If you don’t believe him, do a search on the Federal Reserve. Not that I, Dr. Kris, has an opinion one way or another. A-hem…

Catch a falling doji star in the charts of ANF & GOOG

Wednesday, August 19th, 2009

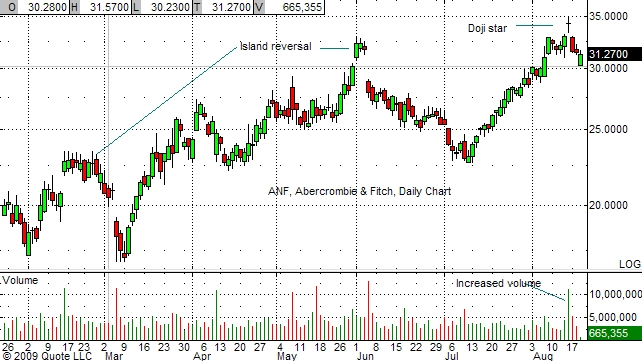
A quick blog to show you a couple of recent examples of a bearish candlestick chart pattern called a doji star. A doji star (a special form of a shooting star) is a candlestick pattern made up of two bars: a bullish bar (typically white or green) followed by a doji (looks like a plus (+) sign). The two candles are separated by a gap. The formation typically occurs at the end of a lengthy bull run.

A doji forms when the bulls lose steam and the bears begin taking over. The day of doji formation is usually accompanied by higher than normal volume. If the following day opens below the low of the doji, this is a sign that the bears have taken control and for long investors to take defensive action.

The charts of internet search engine Google (GOOG) (who coincidentally today is celebrating its fifth birthday as a publicly traded company) and apparel retailer Abercrombie & Fitch (ANF) provide two examples of recent doji stars formations.

Chart of Google (GOOG)

goog-chart-8-19-09

You can see the doji star that formed at the beginning of July after a nice 150 point run-up. The stock pulled back to $400 support before reversing. Support and resistance levels for this issue are found at the $25 levels. Three days ago, Google broke $450 support and is heading towards its next support level at $425. If that doesn’t hold, $400 is its next stop.

Chart of Abercrombie & Fitch (ANF)

anf-8-19-09

A clear doji star was put in four days ago on ANF. It has a history of making island reversals which is a set of candlesticks separated on both sides by gaps. Island reversals don’t necessarily signal a major reversal but they can, especially if they are part of a larger formation such as a head and shoulders pattern.

Abercrombie & Fitch is currently testing major support at $30. If that doesn’t hold, look for a move to $25 then $22.50 below that.*

Summary
I hope this mini instructional lesson will alert you to this major reversal pattern should it appear in the chart of one of your stocks. If it does, that’s a signal for you to closely monitor its movement and take steps to protect your position from potential loss. This can be accomplished by either selling some or all of your position or, if the stock is optionable, by buying protective puts.

*On a personal note, I’d be really happy to see this company go down the tubes because I think their business model stinks. Visit one of their stores and you’ll see what I mean. (See 6/17/09 blog for further kvetching about ANF.)

Rx for an ailing market: Healthcare insurers

Monday, August 17th, 2009

Health insurers and managed care companies breathed a collective sigh of relief today as the Obama administration backed off its push for a nationalized healthcare plan that many thought could be the nail in the coffin for private sector providers. The healthcare insurers as a whole rose over 2.5% today with many of the larger names tacking on gains of 3-5%.

Now, for an industry to have that much traction especially on a down day usually means that if the market reverses and moves higher, the industry will move up disproportionately. If at some point in the not-too-distant future the market regains its bullish tenor, which of these companies is best positioned to benefit? Let’s look at the technical aspects of each of the top five by market cap: Wellpoint (WLP), Aetna (AET), Cigna (CI), Humana (HUM), Coventry Healthcare (CVH).

Wellpoint (WLP):
Market cap: $25.5B
Current closing price: $53.70
% change from all-time high set 12/07: -40%
% change since Nov. 2008 & March 2009 lows: +95; +79%
Notes: Cleared major resistance at $43; next resistance at $58, then $70.

Aetna (AET):
Market cap: $12.9B
Current closing price: $29.63
% change from all-time high set 1/08: -50%
% change since Nov. 2008 & March 2009 lows: + 109; +50%
Notes: Just broke out of an uptrending triangle, a bullish pattern. Near major resistance at $30, then $35. (See chart below.)

Cigna (CI):
Market cap: $8.1B
Current closing price: $29.68
% change from high on 12/07: -48%
% change since Nov. 2008 & March 2009 lows: + 237; +120%
Notes: Very bullish uptrend since 11/08. Broke major resistance at $20 & $25; testing $30 resistance, then $35-$36.

Humana (HUM):
Market cap: $6.0B
Current closing price: $35.53
% change from high on 1/08: -58%
% change since Nov. 2008 & March 2009 lows: + 45; +90%
Notes: Channeled between $27.50 and $32.50 from April; broke out at end of July. Next resistance at $37.50, $41.50, and $50.

Coventry (CVH):
Market cap: $3.5B
Current closing price: $23.60
% change from high on 1/08: -63%
% change since Nov. 2008 & March 2009 lows: + 136; +195%
Notes: Broke out of uptrending island formation on 7/28/09. Minor resistance at $25; major at $30.

Summary & Notes
Ominous topping tails are in all of the candlestick charts of the above stocks. Technicians regard the topping tail as a bearish sign, at least for the short-term. So, if you’re thinking of opening a position in one of these, then you might want to wait for a pullback. This is good advice regardless since the market is aching to correct from its fast and furious run-up.

When it does pull back, the healthcare insurers at the top of my buy list are Coventry (CVH) and Cigna (CI), Technically, their charts are more attractive, perhaps because they’re doing a better job at running their businesses. Coventry raised earnings guidance on July 28 causing the stock to gap up over 5% on the open. Cigna offered mixed guidance, Humana guided in-line, and Wellpoint and Aetna lowered guidance. All companies recently reported several weeks ago.

That’s my technical report. It’s up to you to check the fundatmental health of these companies on your own.

Disclosure: No positions in any stocks mentioned.

aetna-chart-8-17-09

MANDA Portfolio Update

Tuesday, August 11th, 2009

En Pointe Technologies (ENPT) was acquired at the end of trading last Friday, August 7. The transaction returned 13.6% in the MANDA Portfolio, my M&A arbitrage fund. Presently, there are only four open portfolio positions with no pending purchases at this time. Recent M&A activity has been anything but robust, and the few deals that have been announced have been either stock swaps which are outside of my risk tolerance or else they were cash offerings where the arbitrage opportunities were too minimal to be bothered with.

As it stands so far, the portfolio has returned over 5% since inception a little over a year ago and boasts a win/loss ratio of 15 out of 16.

manda-portfolio-8-11-09

Symantec: A textbook example of the value of earnings guidance

Monday, August 10th, 2009

Earnings season is a quarterly event that is much anticipated by traders. The reason is that earnings reports themselves can be newsworthy events and it’s newsworthy events that creates and reinforces the perceptions of the investing and trading community which in turn leads to trading action. If a sector giant (such as Intel, Exxon/Mobil, GE, Amgen, etc.) posts better than expected numbers, this not only bodes well for that particular stock but also for its sector. If the sector is influential in the pricing of certain market indexes, then a rise in one key stock can raise the overall market. This is why traders especially love earnings season because it gives them something to play with for a couple of days at least. Investors look at the full earnings report for longer-term investment indications.

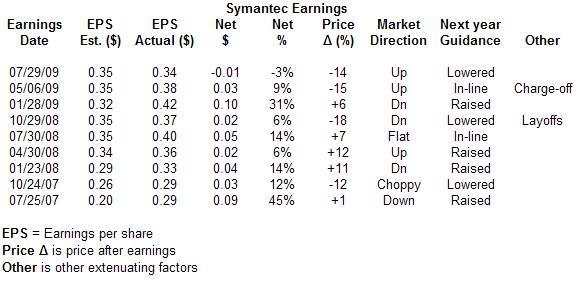
So, if one’s a trader, what is the best way to play earnings and what are some of the key ingredients that make a stock pop or drop? To address these issues, I’ll be using the chart of data storage and software security company Symantec (SYMC) because it’s chart is a graphic illustration of the effects of both good and bad earnings reports.

Earnings data for the past two years are summarized in the chart below.

symc-table-8-10-09

Future guidance is the key to post-earnings stock price
What is most interesting is not whether the company beat analyst estimates, but whether its future outlook beat analyst estimates. “Buy the rumor and sell the news” could never be more true. For those who think they can predict whether or not the company will beat estimates, you can see from the above table that beating estimates has a secondary effect on post-earnings stock price. The primary effect, first and foremost, depends on how the company guides. Even in relatively down markets, a positive guidance can cause the stock to jump, if only temporarily.  (See 1/28/09 on the chart below.)

symc-chart-7-10-09

Earnings plays
Holding stock over earnings is a usually a suckers bet unless there’s nothing to lose. Sometimes a negative earnings report can pop the stock because it wasn’t as bad as Wall Street expected, but that’s not an easy call to make. Usually, most stocks go down after earnings and you don’t want to be the one left holding the bag.

Better to buy a stock with upwardly guided earnings and sell just before the earnings release. This works best if the market is in an upward trend but it can also work in sideways or downward markets depending on how much sizzle is associated with your stock. (Please note that once in a blue moon companies do report earlier than expected so I like selling a day or so in advance.)

Post-announcement plays are a good move, too. Companies that guide higher than Wall Street expectations can ride the wave upward typically for as long as the overall market holds up (barring any negative news on the company). On the flip side, lowered guidance combined with a bear market can be profitable for short positions, but short positions are riskier enterprises with shorter holding times.

Summary
I hope you’ve gotten a feel for how to make some profitable earnings plays. As always, paper-trade your strategy before committing real dough and check out the StockMarketCookBook.com for further earnings recipes.

Disclosure:  No positions

Currency Exchange: Long-term prospects for commodity-based currencies are bright

Wednesday, August 5th, 2009

The Canadian dollar, also known as the loonie or the Canuck buck (as I like to call it), has been making new price highs recently along with the Australian dollar. One big reason is because those currencies along with their country’s economies are tied to commodities—metals, gas, oil—and because of this, US investors are using these currencies as a type of inflation hedge. This is not a bad move considering that many economists feel that massive inflation will be the ultimate result of the quantitative easing by the Fed and other central banks, and inflation means higher commodity prices.

The question is when this inflation will kick in. The general consensus seems to be not until 2010 at the earliest. So is now a good time to pile into these currencies and hard commodities?

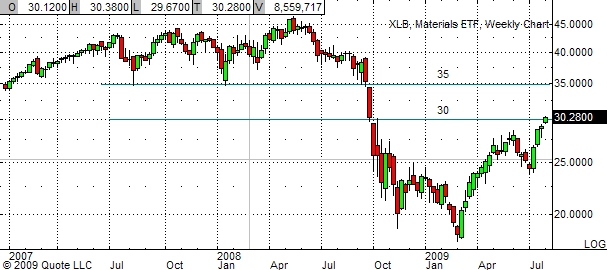
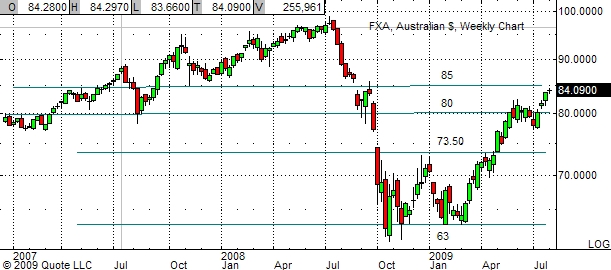
Below are the weekly charts of the Loonie (FXC), Aussie Dollar (FXA), and the Materials SPDR (XLB). You can see that their price movements are quite highly correlated, especially between the XLB and the FXC. All of these ETFs have enjoyed sizable gains since their March lows, and it’s hardly unreasonable to expect them to run out of steam in the near future.

Resistance levels have just been broken
But that’s not what the weekly charts are telling us. Each of these ETFs have broken significant resistance levels in just the past several days and it appears that the next stop is higher: $97 (+5%) for the FXC and $35 (+17%) for the XLB. The Aussie dollar is nearing minor resistance at $85-$86 and it needs to clear that before it can continue its upward jaunt to the mid-$90s.

Future prospects for commodity-based currencies
Long-term prospects for these currencies is excellent because at some point, economies will recover and the need for raw materials, especially in the emerging markets, will explode. But that doesn’t mean that there won’t be any pullbacks before that. A rise in both currencies will make their goods more expensive (especially for us gringos whose buck sucks) thus hampering exports. A pull-back in either currency to one of the support levels shown on the charts would signal a buying opportunity. Forex players may want to keep this scenario in mind, and for you stock players, the percentage play is the XLB over the FXA or the FXC.

fxc-8-05-09

xlb-chart-8-05-09

fxa-chart-8-05-09

Booking profits with online travel companies

Monday, August 3rd, 2009

Online travel booking companies have been taking off lately especially in the wake of Travelzoo (TZOO) and Expedia (EXPE) both posting solid revenues last week. Wall Street analysts today decided to hop aboard the online travel express by upgrading both Orbitz WorldWide (OWW) and Priceline.com (PCLN) probably so they don’t look like idiots when those companies beat their upcoming earnings estimates.

These companies have been moving up solidly in the past several months and according to some analysts, they still have a ways to go. Any of these would make nice additions to a diversified portfolio.

Here’s a brief look at the four top players in the space.

Travelzoo (TZOO)
Barely a year after the company’s IPO in 2003, the stock traded at an all-time high of $110. But by the middle of this past January, the stock had sunk to under $4. It beat earnings in early February and again in April and the stock hasn’t looked back. Although it missed estimates by a penny last week, revenues increased by 12% fueled by an increase in subscribers and strong business overseas.

The stock is butting up against $14 resistance and if it breaks through that, then I’d be all over it.

tzoo-chart-8-03-09

Expedia (EXPE)
Last Thursday, Expedia posted a drop in second quarter profit but its adjusted earnings beat estimates by seven cents with the number of transactions increasing by 18% year over year. It’s chart formed a double bottom in November and March and since then the price has tripled, closing today over $18. The stock faces major resistance at $25, but until then, there are no technical obstacles.

expe-daily-chart

Orbitz WorldWide (OWW)
Based on today’s upgrade, Orbitz took off gaining over 20% on the day as one analyst boosted his price target to $4. At $3.13, it still has a lot of upside. Note that it reports earnings before the bell on Wednesday. Normally, I would say buy this tomorrow on the open and sell it before the close, but holding this stock over its earnings may not be too risky considering today’s action. Conservative investors, however, should wait until after they report.

oww-chart-8-03-09

Priceline.com (PCLN)
Priceline debuted in 1999 right at the peak of the dot.com bubble. It reached a lofty $990 a share before being flushed down the toilet. It, too, put in a double bottom at $7 in 2000 and 2003. After that, it rose to $134 before the recent melt-down hit. But the stock quickly rebounded and is currently testing its previous $134 level. The company has either beat or equaled estimates for every quarter since 2003. That’s quite impressive but we’ll see next week if it can keep up with good work. Earnings are scheduled for August 10th before the bell. I’d wait until the stock breaks $134 before buying and I’d probably sell it before earnings.

pcln-chart-8-03-09

Why the increase in online travel?
A good question to ask is why the increase in online travel? Company suits still need to conduct business in person, Uncle Harry wants to attend his niece’s wedding, and folks still want to spend their vacations someplace else which is why individuals along with corporations are implementing cost cutting strategies to their travel budgets. This is where online travel services have the advantage over traditional travel agents by offering the prospective traveller an array of choices at lower prices, and in a recession, every nickel counts.

So, until the economy eases and people are feeling more financially secure, expect online travel companies to do well. Adding one of these to your portfolio could well be your ticket to increased profits.