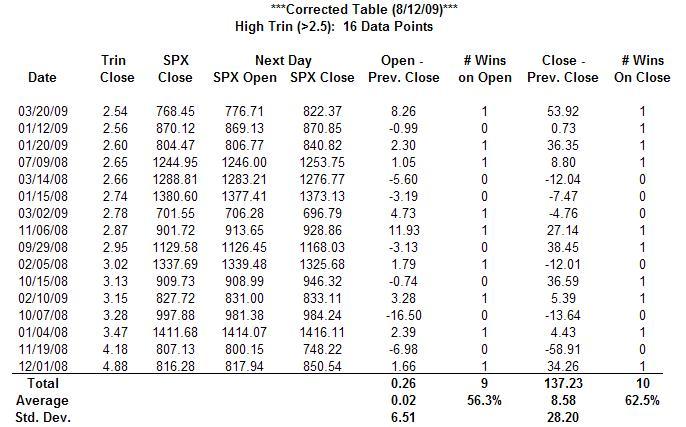
***Note: This blog has been updated to correct a calculation error on one of the Trin tables. The problem was in the left-most Win/Loss column in the High Trin (>2.5) Table. The Excel function that compared the current day’s open with the previous day’s close began on an incorrect cell number. The corrected table is appended to the article.***
Can extreme values of the Trin predict a market reversal?
In last Wednesday’s blog (“Beware the Bull Trap”) I mentioned that extreme values in the Trin, aka the Arms Index, typically precedes a market reversal. High values signal a short-term bottom and low values a short-term top. According to one article on trading with the Trin, the author states that extreme values in the Trin signal a market reversal roughly 90% of the time. I know from extensive experience day-trading the index futures that extreme values in the Trin generally do precede a market reversal, but I wanted to see for myself what is that correlation.
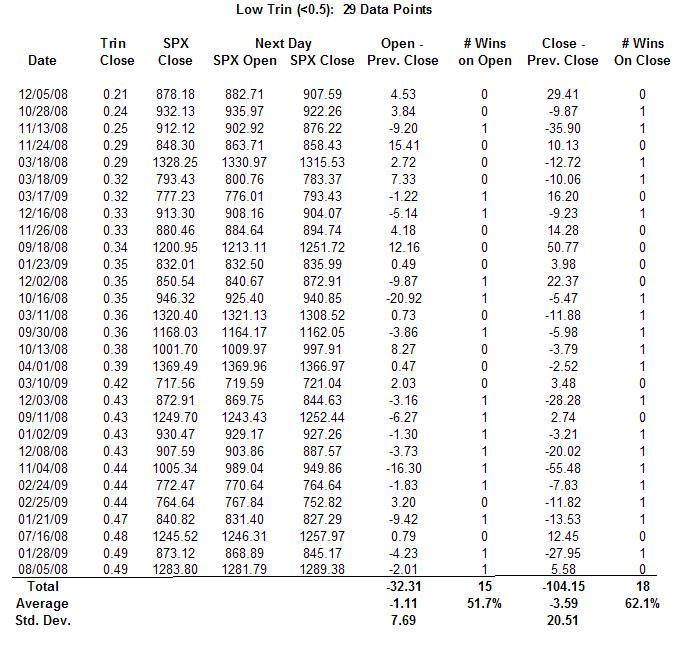
To that end, I analyzed the charts of the Trin and the S&P 500 index for the past year. The two charts below show the results of my analysis. (It also took me all day to do this which is the reason my blog is out so late.)
There is a correlation, but it’s not 90%
The top table shows the correlation between a low closing Trin (<0.5) and the next day’s opening and closing prices on the SPX. The market did, indeed, fall as predicted more times than not, but with a high standard deviation. If you had shorted the SPX on the previous day’s close, the table suggests you’d do better not only return-wise but also percentage-wise by holding your position until the next trading day’s close. Had you made every trade, you would have won 62% of the time averaging three and a half points per trade. That’s not bad especially if you’re trading futures. (Note that these figures do not include commissions or slippage.)
Looking at the other extreme (Trin >2.5), the bottom table shows a similar success ratio for both the opening and closing trades. Had you bought the SPX on the close, you would have profited quite handsomely–over eight and a half points on average!–by holding your position until the next day’s close. In fact, selling on the next day’s open is a break-even proposition at best in this scenario.
Summary
Although there are only 16 data points in one case and 29 in the other, I do believe that’s enough data to infer that extreme Trin values can be used effectively to trade market reversals. High Trin values especially lead to greater profits, and I think that futures traders stand the most to benefit from this strategy. Of course, judicious application of appropriate risk management techniques can reduce loss in those cases when the market doesn’t move as expected as no S&P futures trader wants to get stuck with a 59 point loss!
[Click on charts to enlarge.]
[The next table is incorrect. The corrected table follows.]
[Corrected table 8/12/09.]


