Archive for January, 2010

Take advantage of heightened volatility with covered puts

Sunday, January 31st, 2010

So the market is in correction mode and the volatility has increased…what’s a trader to do? Well, one thing one probably shouldn’t do is buy overpriced put protection. The reason is that even if the market goes down, a decrease in the put’s implied volatility can erase any price gains. Instead of buying high volatility, the smart trader instead sells it, and here’s one way to accomplish that.

The covered put, put simply
During market rallies, covered calls offer a fairly conservative way of generating monthly income; during market corrections, the covered put offers a similar situational risk/reward profile. Basically, a covered put involves shorting stock and writing put contracts against the short position. If the underlying stock falls below the strike price, the stock will be “put” to you which you can use to close out your short position.

Caveats
Keep in mind margin requirements for this position and understand that although the credit you receive from selling the put can offset a small loss if your stock starts to rise, it won’t protect you against major losses if the stock rallies violently. Like the covered call, also be aware that the profit made from this strategy is capped by the strike price of the sold put, i.e., the further out of the money the strike, the greater your potential for profit, but at the expense of position risk as we’ll soon see.

Stock selection
Okay. The market is beginning a corrective phase (which you can tell by the fact that good news is met by price declines). Fear and uncertainty are reflected by an increase in market volatility. You think that now might be a good time to reap some of that volatility by selling covered puts, but what stocks should you choose?

You want to find those issues that have a good reason to continue losing steam. They can be found among the following criteria:

1.Companies that miss earnings estimates, and more importantly, those that have lowered future guidance.
2.Those that are being downgraded by analysts. {Analysts typically do this as a reactionary move after a negative event has already occurred, but if the downgrade comes during a period of no news and is based on something different, such as a revised earnings estimate, then I’d give more creedence to it.)
3.Companies issuing bad news such as: a new product that isn’t as well-received as anticipated (the iPad?); a biotech’s latest drug doesn’t pass clinical trials; the company’s novel products suddenly have competitors, etc. And the best of the bad news…
4.Accounting scandals; key management changes; government intervention; new regulations that will adversely affect the company’s bottom line, etc.

Certainly, there are many other reasons why a stock will underperform; these are only a few of the more typical explanations.

A current covered put play: Sandisk (SNDK)
On Friday (1/29), the stock of chip-maker Sandisk (SNDK) fell almost 12% from the close on Thursday to the close on Friday.

Why? On the not particularly bad news that revenues were what analysts expected. (See? This is a sign of a correction in progress!) According to a Wedbush-Morgan analyst, expectations for the company were running high (particularly since it’s part of the iPad story) and investors were disappointed that the company didn’t beat expectations.

Taking in the broader picture, shares of fellow chip-makers Micron Technologies (MU), EMC (EMC), and Seagate (STX) all lost ground along with the semiconductor ETF, the SMH.

SNDK Chart 1-31-10

Looking at the stock chart of Sandisk, we can see that it gapped through key support at $28. It’s showing minor support at the even $2 levels ($24, $22) with major support at $20.

Using end of day data for stock and options prices, here’s how the February covered put fares for the closest strike prices (the stock closed Friday at $25.42).

Sandisk Table 1-29-10Depending on your risk/reward profile, you can see how investing in OTM (below $25) strikes differs from the ITM (above $25) strikes. If you think that your particular stock and/or the market may rebound before expiration, sell an ITM strike (the exact strike price depending on your degree of unbearishness). On the other hand, if you believe the opposite, sell an OTM strike.

Repair strategies
If the stock in your covered put starts to move up, you can either buy back your put option and close out your short stock position, or keep your short  position and roll up your put position to a higher strike price. This is where experience in playing this type of option strategy is very helpful.

Summary
The point of this post is to educate those of you who are options savvy and unafraid of shorting stocks as to a strategy that can be used to your advantage when the market is in a correctional phase. If you need a springboard for candidates to short, check out my Blue Plate Specials that lists the new yearly lows as well as those stocks breaking down. The list is posted daily both here on my website and on SeekingAlpha, usually one to two hours before the market closes. Please remember to do your own due diligence before attempting this type of trade!

Is your ETF dying?

Tuesday, January 19th, 2010

When most of us think of ETFs (electronically traded funds), we typically think of the SPY, the DIA, and the QQQQ, those stalwart index tracking stocks that have been with us for more than a decade (seventeen years for SPY!). We’ve grown downright comfortable with them, as evidenced by their ever-swelling trading volumes, and most of us tacitly assume they’ll be around for as long as their underlying indexes are alive and kicking.

But that isn’t the case for some of the more recent additions to the ETF universe. Take for example the BEO, the Enhanced S&P 500 Covered Call Fund. This fund seeks leveraged returns based on the CBOE S&P 500 Buy-Write Index (index symbol: $BXM). All well and good, but what isn’t apparent is that this fund, along with some of its brethren, have short shelf lives. What does this mean?

It means that they’ll be expiring soon. According to a representative from the fund issuer, IQ Investment Advisors (now owned by Bank of America), the BEO was designed specifically to take advantage of increased market volatility and was never meant as a long-term investment vehicle.

According to the fine print on the fund’s fact sheet, the BEO is scheduled for termination in October. However, the customer service rep said that the fund’s board could opt for an earlier closure, most likely a month or two sooner.

So, what does this mean for those joes who are long BEO? It means that at fund termination, they will receive whatever the net asset value (NAV) of its holdings are at that time. If the fund’s recent precipitious price drop is any indication, it looks as if investors are already jumping ship.

Take a look at the BEO compared with its underlying index and you’ll see why I suspected something was afoot:

BEO Chart 1-19-10

$BXM Chart 1-19-10
Because of its enhanced nature, the BEO won’t perfectly track the $BXM. In fact, if you look at a daily chart of both you’ll see that the BEO spikes up right before its semi-annual distributions in mid-December and mid-June. It’s been paying $1.10 consistently ($2.20 annually) since 2005 inception but the customer service rep I spoke with said that because of falling market volatility, upcoming distributions on covered-call based funds will most likely be reduced giving investors another reason to head for the exits.

Other IQIA fund family expiration dates
Within this family of eight funds, the two other covered call based funds are also set to expire soon. The termination date of the S&P 500 Covered Call Fund (symbol: BEP) is 3/31/10 and that of the Small Cap Premium & Dividend Income Fund (symbol: RCC) is 7/23/10. The company’s rep said that these funds, too, could terminate earlier then their printed expiration dates. Just so you know.

Summary
As with most purchases, it’s caveat emptor and another good reason why it’s so important to read the fine print, especially for volatility-sensitive ETFs. If you’re unclear on how a fund operates, don’t hesitate to call the fund’s issuer or consult your investment advisor.

Final Note: Comparison of returns of BEO vs the S&P 500 tracking stock (SPY)
On a lark, I decided to look at the returns of the BEO since 1/3/2006 (I wanted to give the fund a few months to find its sea legs) and compare those with the performance of its underlying index, the $BXM, as well as the S&P 500 tracking stock, SPY.

BEO vs SPY Table 1-19-10

The table shows that the SPY out-performed the BEO on a price appreciation basis; adding in the dividends gave the edge to the BEO. But the surprising thing was that the $BXM out-performed both even with no help from dividends!

For further reference:
“An In-Depth Look at the New Covered Call ETFs,” Richard Shaw. Seekingalpha.com, 6/6/07.

New website feature: Chart of the Day—Joy Global (JOYG)

Thursday, January 7th, 2010

The Stock Market Cook Book’s sous chefs are in the process of redesigning and updating the website which is one reason why blogging activity has fallen off in recent weeks. But today I’ve decided to introduce a new feature called “Chart of the Day” that will appear when I find a compelling chart that illustrates aspects of technical charting, provides a clearly defined trade set-up, or better yet, both.

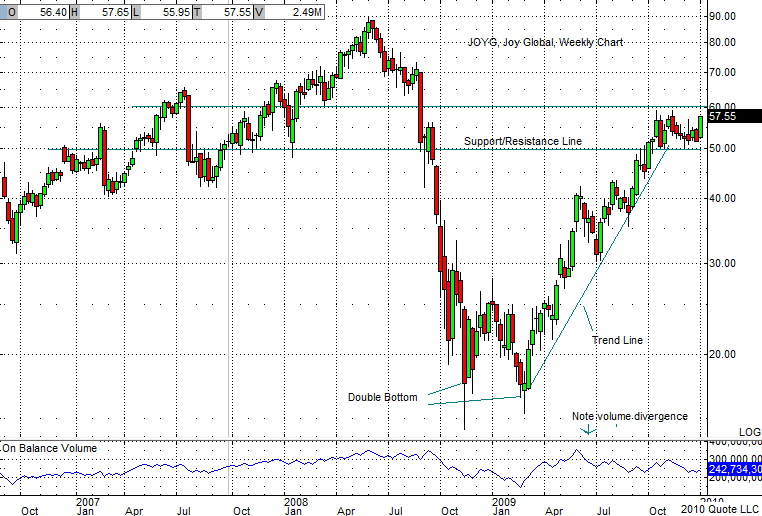
Today’s chart of Joy Global (JOYG), a heavy mining equipment maker based in my home state of Wisconsin, shows basic charting elements which suggest some possible trading strategies. Let’s first look at its weekly candlestick chart:

JOYG Weekly Chart 1-07-10

Just before the market crashed in 2008, the stock hit its $90 peak before tumbling 75 points. It roared out of a double bottom in the middle of March, eventually settling into a trading zone between $50 and $58 where it’s been biding its time for the past three months.

Trading Strategies
For those of you who like channeling stocks (stocks that bounce between levels of support and resistance), you could try playing this one for $5-$8 on either side.

The other strategy is much more compelling.

When, after a long period of consolidation, a stock finally breaks one of its channeling boundaries means that it will most likely continue in that direction. And the greater the volume accompanying the breakout, the more likely and more forceful will be the ensuing movement. Typically, any type of news can propel consolidating stocks out of their range–upgrades/downgrades, good/bad earnings, a change in management, a large product order, a canceled product order, stock take-over rumors, positive/negative clinical data (for drug companies), etc.

So, is there anything on the horizon likely to move JOYG? Glad you asked! The company blew away December earnings estimates and may do the same when they next report in early March. Company executives were quoted as saying they expect the order rate to be improving in 2010. But March is more than a month away—might not there be anything else in the offing?

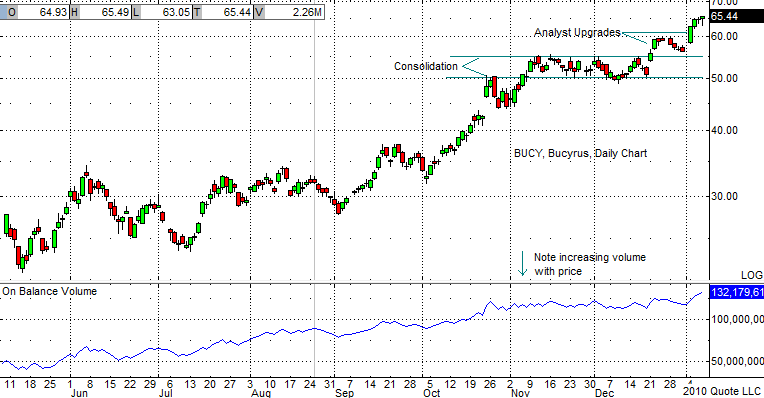
Bucyrus (BUCY), Joy’s major competitor also based in Wisconsin, was recently upgraded to a Buy rating by Barclay’s with a price target of $73. Barclay analyst Andy Kaplowitz expects Bucy’s revenue to meet or surpass last year’s and raised estimates–just like Joy did last month. Joy sports a more than decent balance sheet (for more info see this SeekingAlpha article) and it’s certainly not a wild stretch of the imagination that it, too, could be soon upgraded.

If and when that event occurs, expect a pop over $58. But don’t rush into a long position just yet–the pop should be on heavy volume. The reason is that the “smart money” has recently been preferring Bucyrus over Joy, as evidenced by their divergent On Balance Volumes (OBV) shown in their daily charts:

JOYG Chart 1-07-10

BUCY Chart 1-7-09

Summary
What with the rising price of commodities due to global demand–especially coal which benefits both Joy and Bucyrus–it’s not hard to imagine that both stocks will significantly rise in price over the next few years. Despite the fact that domestic orders for mining products have been down recently due to economic conditions, experts are predicting an increase in the next couple of years, boding well for the industry.

To me, the higher percentage play is Joy when it breaks out. Bucyrus has already done so; now it’s Joy’s turn. So, be patient and wait for the soup to come to a boil before dipping in.

Ah…the joy of cooking!